MARCH KEY FIGURES
 | Dec Qtr 16 to Mar Qtr 17 | Mar Qtr 16 to Mar Qtr 17 |
| STAGE OF PRODUCTION | % change | % change |
|
| Final demand (excl. exports) | 0.5 | 1.3 |
| Domestic | 0.5 | 1.9 |
| Imports | -0.1 | -3.5 |
| Intermediate demand | 0.8 | 2.2 |
| Domestic | 0.8 | 2.5 |
| Imports | 1.3 | -0.7 |
| Preliminary demand | 0.9 | 2.1 |
| Domestic | 0.8 | 2.7 |
| Imports | 1.5 | -0.8 |
|
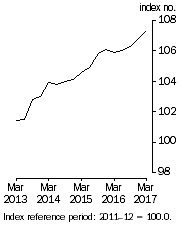
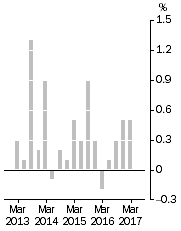
Stage of Production Final Demand

| Stage of Production Final Demand, Quarterly % change

|
MARCH KEY POINTS
FINAL DEMAND (EXCL. EXPORTS)
- rose 0.5% in the March quarter 2017.
- mainly due to rises in the prices received for Electricity supply, gas supply; and water supply, sewerage and drainage services (+2.9%), Building construction (+0.5%) and Petroleum refining and petroleum fuel manufacturing (+6.8%).
- partly offset by falls in the prices received for Specialised machinery and equipment manufacturing (-2.6%), Motor vehicle and motor vehicle part manufacturing (-0.8%) and Commercial fishing (-17.6%).
- rose 1.3% through the year to the March quarter 2017.
INTERMEDIATE DEMAND
- rose 0.8% in the March quarter 2017.
- mainly due to rises in the prices received for Electricity supply, gas supply; and water supply, sewerage and drainage services (+5.5%), Petroleum refining and petroleum fuel manufacturing (+8.2%) and Oil and gas extraction (+9.0%).
- partly offset by falls in the prices received for Employment services (-2.8%), Printing and printing support services (-6.9%) and Rental and hiring services (excluding real estate) (-1.8%).
- rose 2.2% through the year to the March quarter 2017.
PRELIMINARY DEMAND
- rose 0.9% in the March quarter 2017.
- mainly due to rises in the prices received for Electricity, gas and water supply (+5.6%), Petroleum refining (+8.9%) and Oil and gas extraction (+9.0%).
- partly offset by falls in the prices received for Employment services (-2.8%), Rental and hiring services (excluding real estate) (-2.4%) and Coal mining (-8.7%).
- rose 2.1% through the year to the March quarter 2017.
NOTES
FORTHCOMING ISSUES
| ISSUE (QUARTER) | Release Date |
| June 2017 | 28 July 2017 |
| September 2017 | 27 October 2017 |
| December 2017 | 2 February 2018 |
| March 2018 | 27 April 2018 |
CHANGES IN THIS ISSUE
For the March quarter 2017, three additional series were included in the Time Series Spreadsheets. These indexes have been incorporated into the stage of production indexes for the March quarter 2017.
Table 27. Output of the Other services industries, group and class index numbers include:
- Class 9531 Laundry and Dry-cleaning services.
Table 34. Output of the Education and Training industries includes group and class index numbers for:
- Class 8102 Higher Education, Domestic
- Class 8102 Higher Education, Exports
CHANGES IN FUTURE ISSUES
From the June quarter 2017, the following additional series will be included in the the Time Series Spreadsheets. These indexes will be incorporated into the stage of production indexes from the June quarter 2017.
Table 35. Output of the Health care and social assistance industries will include group and class index numbers for:
- Group 851 Medical services
- Class 8511 General practice medical services
- Class 8512 Specialist medical services
- Group 852 Pathology and diagnostic imaging services
- Class 8539 Other allied health services
- Group 871 Child care services
ROUNDING
Any discrepancies between totals and sums of components are due to rounding.
PRIVACY
The ABS Privacy Policy outlines how the ABS will handle any personal information that you provide to us.
INQUIRIES
For further information about these and related statistics, contact the National Information and Referral Service on 1300 135 070.
 Quality Declaration
  Print Page
 Print All